Background
Under the former federal education law—No Child Left Behind—the US Department of Education required states to establish “ambitious but achievable” AMOs in reading and mathematics proficiency as well as in graduation and attendance rates, and to publicly report performance on the AMOs.
The following were the AMOs used in Wisconsin until the federal education law was reauthorized as the Every Child Succeeds Act (ESSA) in December 2015. ESSA ended the use of AMOs in school accountability systems. However, for those interested in accountability history and those who want to reference the former AMO targets, please refer to the charts below.
What were the AMOs?
The US Department of Education (USED) required states to establish ambitious but achievable AMOs in reading and mathematics proficiency and in graduation and attendance rates, and to publicly report performance on the AMOs. Using 2011-12 data, AMOs were set to move all schools in the state, within six years, to the level of those schools that were performing at the 90th percentile in 2011-12. That is, by 2016-17, the expectation was for all schools to have all student groups reach about 50% reading proficiency and 65% mathematics proficiency.
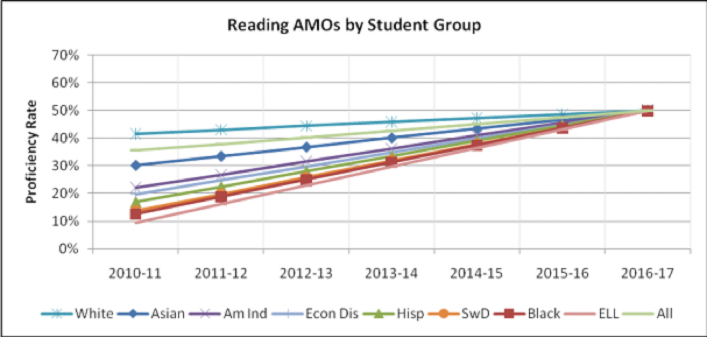
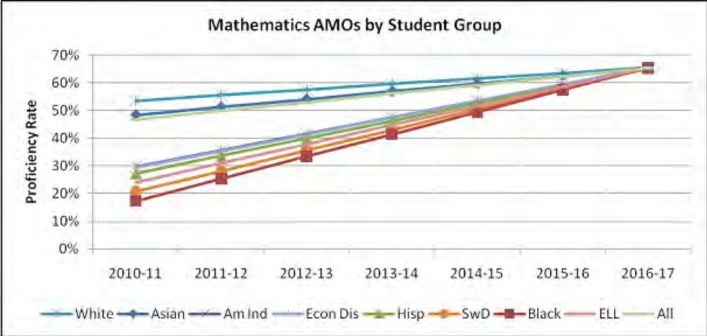
These AMOs reflected the higher college and career ready cut scores established in Wisconsin’s waiver request for ESEA Flexibility. The AMOs expected an increase of 1% or more in proficiency rates annually. This assured that the top-performing subgroups would continue to make progress. The six-year targets of 49.9% proficiency in reading and 65.3% proficiency in mathematics reflected dramatic increases in performance for most subgroups.
| Annual Increase | Wisconsin Reading Proficiency AMOs | |||||||
| 2010-11 | 2011-12 | 2012-13 | 2013-14 | 2014-15 | 2015-16 | 2016-17 | ||
| All Students | 2.4% | 35.5% | 37.9% | 40.3% | 42.7% | 45.1% | 47.5% | 49.9% |
| American Indian | 4.7% | 22.1% | 26.8% | 31.5% | 36.2% | 40.9% | 45.6% | 50.3% |
| Asian or Pacific Islander | 3.3% | 30.2% | 33.5% | 36.8% | 40.1% | 43.4% | 46.7% | 50.0% |
| Black not Hispanic | 6.2% | 12.6% | 18.8% | 25.0% | 31.2% | 37.4% | 43.6% | 49.8% |
| Hispanic | 5.5% | 17.0% | 22.5% | 28.0% | 33.5% | 39.0% | 44.5% | 50.0% |
| White not Hispanic | 1.4% | 41.6% | 43.0% | 44.4% | 45.8% | 47.2% | 48.6% | 50.0% |
| Students with Disabilities | 6.0% | 13.8% | 19.8% | 25.8% | 31.8% | 37.8% | 43.8% | 49.8% |
| Economically Disadvantaged | 5.0% | 19.8% | 24.8% | 29.8% | 34.8% | 39.8% | 44.8% | 49.8% |
| English Language Learners | 6.7% | 9.6% | 16.3% | 23.0% | 29.7% | 36.4% | 43.1% | 49.8% |
| Annual Increase | Wisconsin Mathematics Proficiency AMOs | |||||||
| 2010-11 | 2011-12 | 2012-13 | 2013-14 | 2014-15 | 2015-16 | 2016-17 | ||
| All Students | 3.1% | 46.7% | 49.8% | 52.9% | 56.0% | 59.1% | 62.2% | 65.3% |
| American Indian | 5.9% | 29.7% | 35.6% | 41.5% | 47.4% | 53.3% | 59.2% | 65.1% |
| Asian or Pacific Islander | 2.8% | 48.4% | 51.2% | 54.0% | 56.8% | 59.6% | 62.4% | 65.2% |
| Black not Hispanic | 8.0% | 17.4% | 25.4% | 33.4% | 41.4% | 49.4% | 57.4% | 65.4% |
| Hispanic | 6.3% | 27.3% | 33.6% | 39.9% | 46.2% | 52.5% | 58.8% | 65.1% |
| White not Hispanic | 2.0% | 53.5% | 55.5% | 57.5% | 59.5% | 61.5% | 63.5% | 65.5% |
| Students with Disabilities | 7.4% | 20.8% | 28.2% | 35.6% | 43.0% | 50.4% | 57.8% | 65.2% |
| Economically Disadvantaged | 6.0% | 29.4% | 35.4% | 41.4% | 47.4% | 53.4% | 59.4% | 65.4% |
| English Language Learners | 6.9% | 24.0% | 30.9% | 37.8% | 44.7% | 51.6% | 58.5% | 65.4% |
How were AMOs measured?
A group’s performance compared to its AMO was measured by the higher of (1) the proficiency rate in the current year; or (2) the average proficiency rate in the current year and the prior year. A cell size of 20 and a 95 percent confidence interval were applied to determine whether or not an AMO was met.
Wisconsin used the graduation rate goal of 85 percent. Separate graduation rate improvement targets are used for the four- and six-year rates. A school met the graduation rate AMO for graduation if (1) the graduation rate for the most recent year, or for the most recent two years combined, met the 85 percent goal; or (2) the improvement in graduation rate met the applicable target.
DPI would first evaluate whether a school met the goal or target for the four-year rate. If it did not, the school would be evaluated using the six-year rate. In 2011-12, the first year of this accountability system, a five-year rate was used in place of the six-year rate for the initial year only because Wisconsin did not have enough data to run a six-year rate until 2012-13.
The graduation targets for AMO determinations beginning with those based on 2011-12 assessment results are:
| Graduation Rate | Four-Year Graduation Rate Improvement Target |
Six-Year Graduation Rate Improvement Target |
| 60% to 85% | 2 percentage points | 5 percentage points |
| Less than 60% | 5 percentage points | 5 percentage points |
For a school, a group’s performance compared to its AMO was measured by the higher of the four- or six-year cohort graduation rates for that group. (As with other graduation components of this system, for the first year a five-year cohort rate was used in place of the six-year rate.) A cell size of 20 and a 95 percent confidence interval was applied to determination of whether or not an AMO was missed.
An attendance rate AMO was applied when the graduation rate AMO was not applicable. A school met the attendance rate AMO if (1) the attendance rate was 85.0% or above in the most recent year or (2) there was a 0.1% gain in attendance rate. The attendance rate AMO was applied to the all students group only. A cell size of 20 was applied.
How were AMOs reported?
USED required states to establish ambitious but achievable AMOs in reading, mathematics, and graduation and to publicly report performance on each. AMO data were reported publicly on school report cards beginning with the 2011-12 school year. AMOs were part of Wisconsin’s accountability system, but they were not used to calculate the accountability scores that determine ratings and support. In other words, AMOs were not factored into the accountability index; they existed outside the accountability index but were reported alongside it.
How were AMOs used by schools?
Since schools received a school report card and the AMOs were included in the school report card data, schools could readily gauge progress with their students and specific student groups using school report card data. Schools could pinpoint how much progress their students and each student group needed to make by 2016-17, potentially establishing multi-year improvement plans to use as a focal point. Specifically, AMOs were used as part of the exit criteria for Title I Focus Schools as well as accountability for English Language Learners under ESEA Title III.
For those Title I schools that were identified as Title I Priority or Title I Focus schools, AMOs were used as part of the exit criteria from those identifications (a four-year cohort). As such, these schools would have needed to pay particular attention to the progress of student groups each year of the cohort.
AMOs were also used as part of the accountability for English Language Learners under ESEA Title III so schools could track the progress of their English learner population.