Tuesday, November 12, 2019
Contact
DPI Media Line, (608) 266-3559MADISON — The Department of Public Instruction announced the percentage of public and private schools and public school districts meeting expectations on state report cards remains high. On state report cards issued for the 2018-19 school year, overall 87 percent of rated schools met or exceeded expectations as did 96 percent of the state’s 421 public school districts.
This is the fourth year the report cards used legislatively required calculations, and the fourth year private schools in the Milwaukee, Racine, and statewide parental choice programs received report cards. For 2018-19, 2,112 public schools and 322 private choice schools received report cards. Of choice schools, 106 exercised the option to receive an all student report card in addition to the required report card for choice students only.
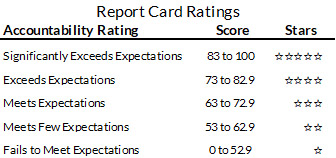
Report card ratings range from five stars, denoting schools and districts that significantly exceed expectations, to one star for those that fail to meet expectations. Scores are calculated in four priority areas: student achievement; school growth; closing gaps between student groups; and measures of students being on-track for postsecondary readiness, which includes graduation and attendance rates, third-grade English language arts achievement, and eighth-grade mathematics achievement. Report cards provide a snapshot of performance across the four priority areas and can be used to target improvement efforts.
 Scores are reduced for schools and districts that miss student engagement indicator goals of keeping absenteeism below 13 percent and dropout rates below 6 percent. The last five years have each seen an increase in the number of schools receiving the absenteeism deduction. For the 2018-19 school year, 153 school report cards lost five points from the accountability score for missing the absenteeism target, up from 125 in the 2017-18 school year.
In situations where there is insufficient data to calculate a score in a priority area, such as not having enough prior years for comparison in the growth measure, the measure is omitted, not counting toward the overall score, so that the remaining measures weigh more heavily.

This year, a score in the area of closing gaps was also omitted if that score would have changed at least 20 points (positive or negative) from last year. Such large score changes typically result from the effect of changing numbers of students in a subgroup, rather than actual changes in performance. The removal of large-swing scores in the closing gaps area applied to 150 schools and five districts and is a one-year change.
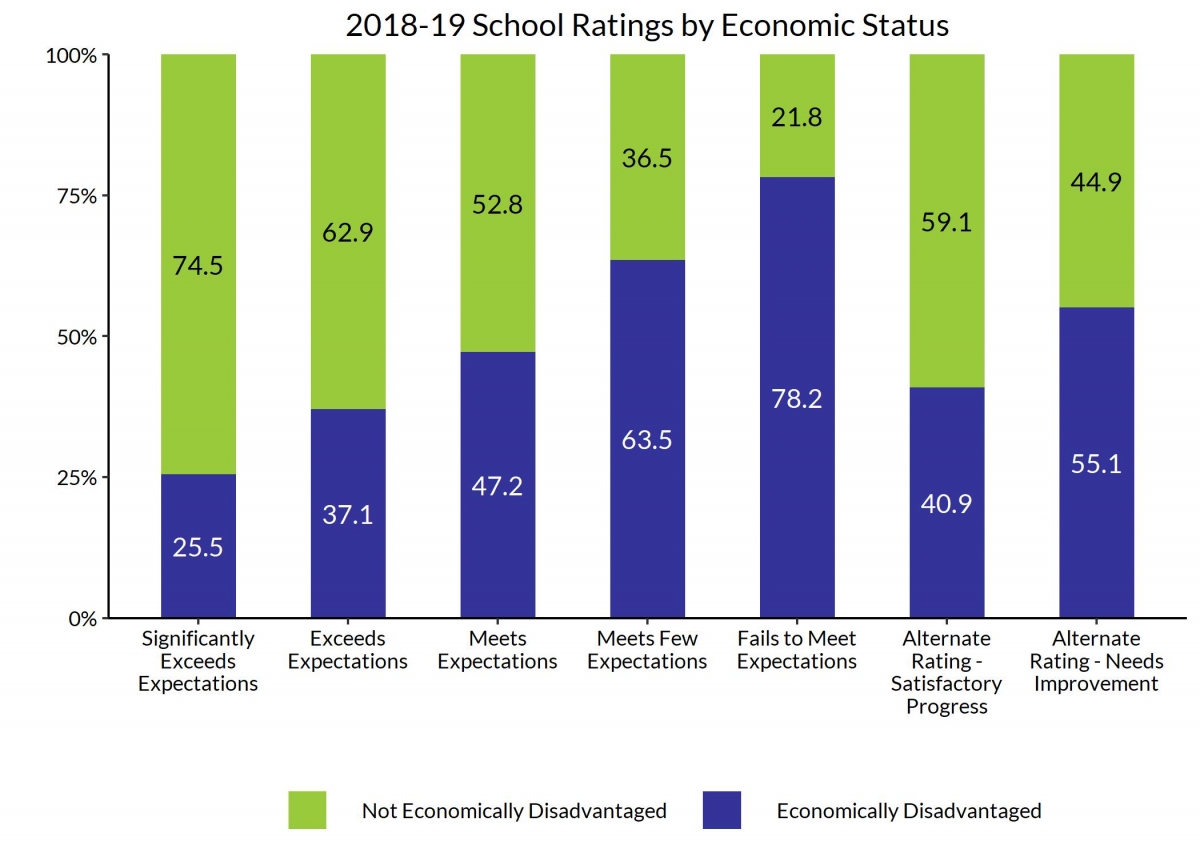
By law, the more students who are economically disadvantaged in a school or district, the more weight is given to the growth score. In spite of this effort to account for the challenges of poverty, schools and districts with lower accountability ratings on average have higher poverty levels than those with higher accountability ratings. For the 2018-19 report cards, schools that meet few expectations (two stars) have 63.5 percent of students who are economically disadvantaged (ECD). Schools that fail to meet expectations (one star) have an ECD rate of 78.2 percent. Schools that self-identify as needing improvement through alternate accountability have a combined ECD rate of 55.1 percent. Conversely, schools at the five-star accountability rating, significantly exceeds expectations, have only 25.5 percent of students from economically disadvantaged backgrounds.
 District Report Cards
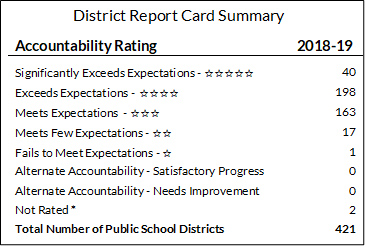
For 2018-19 report cards, 40 districts were rated at the highest accountability level, a five-star rating, meaning they significantly exceed expectations. Forming the largest group are 198 districts achieving four stars, which means they exceed expectations. The three-star, meets expectations, rating was given to 163 districts. Seventeen districts were rated two stars, meets few expectations. One district failed to meet expectations, the one-star category. No districts were rated using the alternate accountability measures this year.
Report cards with fluctuations of 10 or more points on the overall score from the prior year carry a ^ notation because the department considers this amount of change an outlier which may not reflect the actual magnitude of change in performance and should be interpreted with caution. Six district report cards, or around 1 percent, carry the ^ notation.
School Report Cards
At the school level, 318 public and private school report cards earned five stars (significantly exceeds expectations), 807 earned four stars (exceeds expectations), 679 earned three stars (meets expectations), 210 earned two stars (meets few expectations), and 53 earned one star (fails to meet expectations). As with district report cards, the 192 schools with ratings that fluctuated 10 or more points carry the ^ notation. Of the schools receiving report cards through the alternate accountability process, 151 were rated as making satisfactory progress and 27 were rated as needing improvement. Alternate accountability (AA) is a self-evaluation of a school’s performance on raising student achievement in English language arts, mathematics, and attendance or graduation rates. It is used for new schools, schools without tested grades, schools exclusively serving at-risk students, and schools with fewer than 20 full-time academic year students who took tests. Private schools participating in a parental choice program do not participate in alternate accountability. The report cards for the 189 choice schools with insufficient data for 2018-19 carry the designation of not rated because of data.